

Key takeaways
- Salesforce reports go wrong in exactly three places: report configuration, record visibility, or the underlying data itself.
- Diagnose before touching anything: different numbers for two people means visibility; different numbers from two reports means configuration, usually a mismatched date field.
- Three data patterns break correct reports: duplicates inflate totals, stale opportunities pad open pipeline, and blank fields silently drop records from filters.
- The report is a mirror; if the reflection is wrong, adjusting the mirror changes nothing. Fix the records, not the filters.
- Scan revenue-critical objects on a schedule and run a quality pass before QBR season, so bad data never reaches a leadership deck.
A sales leader opens the pipeline dashboard before a forecast call and sees $4.2M in the current quarter. The RevOps analyst pulls the same stage from a different report and gets $3.7M. A rep swears their two biggest deals are missing entirely. By the time the meeting starts, nobody is arguing about the pipeline. They are arguing about the report.
This is how dashboards die. Not in one dramatic failure, but in a slow drip of small discrepancies that teach people to trust their gut over the numbers. Once a rep learns that the report undercounts their deals, they stop using it. Once a manager gets burned quoting a bad figure to their VP, they build a private spreadsheet instead. The dashboard is still there. It just doesn’t run anything anymore.
The good news: an inaccurate Salesforce report almost always has a specific, findable cause. The bad news: teams usually chase the wrong one. They rebuild the report when the data is broken, or they scrub records when the filter was wrong all along. This post gives you a way to tell the difference in a few minutes, then fix the problem where it actually lives.
Why are my Salesforce reports inaccurate?
Salesforce reports are inaccurate for one of three reasons: report configuration, record visibility, or the underlying data. Configuration problems come from filters, date ranges, cross-filters, and report type joins that silently include or exclude the wrong records. Visibility problems come from sharing rules and permissions, so two people run the same report and see different numbers. Data problems come from the records themselves being wrong: duplicates inflating totals, stale opportunities sitting in open stages, and blank fields that filters quietly drop. Fixing the report only helps with the first cause. The other two need to be fixed at the source.
Most “wrong report” complaints are actually one of these three wearing a disguise. So before you touch a single filter, find out which one you have.
Three places a number goes wrong
Every figure on a Salesforce report passes through three gates before it reaches the screen. A break at any gate produces a wrong number, and each break looks slightly different.
Report configuration. This is everything you control in the report builder: the report type, filters, date field and range, row limits, cross filters, and grouping. A pipeline report set to “Close Date THIS QUARTER” behaves very differently from one set to “Created Date THIS QUARTER.” A cross filter of “Accounts without Opportunities” flips your count the moment someone misreads it. Configuration errors are the most common cause and the fastest to fix, because they live entirely inside the report.
Record visibility. Salesforce shows each user only the records they are allowed to see. Org-wide defaults, role hierarchy, sharing rules, and the report’s own “show me” scope all shape the result set. A manager and a rep can run the identical report definition and get different totals because they own and can see different records. Nothing about the data or the report is broken. The two people are simply looking through different windows.
Underlying data. This is the records themselves. Duplicate opportunities count a deal twice. An opportunity stuck in “Negotiation” since last year still counts as open pipeline. A record with a blank Region field vanishes from any report grouped or filtered by Region. The report is built correctly and everyone sees the same total, but the total describes dirty data. This is the hardest cause to spot, because the report looks healthy while quietly reporting garbage.
The trap is that all three produce the same symptom: a number that feels wrong. You cannot fix what you have not diagnosed, so start with a test that tells the three apart.
The diagnostic decision tree
Run these checks in order. Each one either identifies the cause or clears a suspect and sends you to the next. Stop at the first match.
-
Two people run the same report and get different numbers. The cause is visibility and permissions. The report definition is identical, so the only variable left is who can see which records. Check the report’s “show me” scope (My vs. All), then check sharing rules and role hierarchy for the object. Do not touch filters or data.
-
One person gets different numbers from two reports that should match. The cause is configuration. Compare the two definitions field by field: report type, date field, date range, filter logic, and any cross filters. The usual culprit is a mismatched date field, such as one report filtering on Close Date and the other on Created Date.
-
The number changes when you widen the date range or switch the date field. The cause is configuration, specifically the date logic. A deal with a Close Date in a future quarter will not appear in a current-quarter close report even though it is live pipeline. Decide which date the report should measure and set it explicitly.
-
A known record is missing, and it has a blank in a field the report filters or groups on. The cause is data. Filters silently exclude records with null values, and grouped reports drop records with no value in the grouping field. A filter of “Region equals West” removes every record where Region is blank, including deals that belong in West but were never tagged. Find the blank fields, not a report bug.
-
The total is too high and the record count looks inflated. The cause is data, usually duplicates. Group the report by a key field such as Account Name or Opportunity Name and look for repeats. Two opportunities for the same deal double the amount. This is common after bulk imports and integration syncs.
-
The total is too high and includes deals that should have closed months ago. The cause is data, specifically stale records. Open pipeline reports count every opportunity in an open stage regardless of age. An opportunity in “Proposal” with a Close Date six months in the past is stale, not active. Check the Last Modified date and the age of the Close Date.
-
Everyone sees the same number, the config is clean, no field is blank, no duplicates, no stale records, and it is still wrong. Now, and only now, rebuild the report. You have cleared the three common causes, so the remaining suspects are report type joins, row limits truncating results, or a formula field returning the wrong value.
The order matters. Visibility and configuration are cheap to check and account for most complaints. Only after you clear those does data become the prime suspect, and data is where the real work lives.
When the data is the problem
Steps 4 through 6 point at the data, and this is where reports quietly betray you. The report is built correctly. Everyone agrees on the number. The number is still wrong, because the records feeding it are wrong. Three patterns cause most of it.
Duplicates inflate the total. A duplicate opportunity counts its amount twice. Duplicate contacts inflate lead volume and skew per-account metrics. Duplicates tend to arrive in batches from imports and integration syncs, so a report can be accurate on Monday and inflated on Tuesday after a sync doubles two hundred records. A pipeline that jumps overnight without new deals is a duplicate signal.
Stale records inflate open pipeline. An opportunity in “Negotiation” for eleven months is not pipeline. It is a record nobody closed. Reports that sum open stages have no way to know the difference between a live deal and an abandoned one. The forecast looks strong right up until the quarter ends and half of it evaporates.
Blank fields silently exclude records. This one is invisible, which makes it the worst. A filter of “Lead Source equals Webinar” returns zero webinar leads whose Lead Source field was never filled in. A report grouped by Owner drops every record with no owner. The records exist. They just fail the filter because a field is empty, and nothing on the report tells you they were removed.
The pattern across all three: the fix does not live in the report. You can rebuild the pipeline report a dozen times and it will keep double-counting the duplicate opportunity, keep including the stale deal, keep dropping the blank-field record. The report is a mirror. If the reflection is wrong, adjusting the mirror changes nothing.
Fix at the source, not in the report
Report-side band-aids are tempting because they are fast. You add a filter to exclude the stale deal, or a workaround to catch the duplicate. Then next quarter the same problems return with new records, and your report definition grows a thicket of exceptions nobody remembers the reason for.
Fixing at the source means finding the bad records, correcting them where they live, and then running the report clean. That takes a way to detect the problems systematically, because eyeballing a report grouped by name does not scale past a few hundred rows.
This is where a data quality scan earns its place. Data Quality Sense scans any Salesforce object and measures the exact conditions that break reports: completeness surfaces the blank fields that filters silently drop, uniqueness counts the duplicate opportunities and contacts inflating your totals, and timeliness flags the stale records aging out of relevance. Instead of a report that is wrong for reasons you cannot see, you get a list of the specific records causing it.
DQS detects and reports. It does not clean, merge, or edit records for you. What it does is route the findings to the people who can fix them. From a scan result, you create Salesforce Tasks assigned to record owners and post Chatter messages that tag the right people, so the rep who left Region blank on twelve opportunities gets a task to fill it in. The workflow is straightforward: scan to find the bad records, route the findings to owners as Tasks and Chatter, let people correct the records, then re-run the report. The number changes because the data changed, not because you bent the report around a problem.
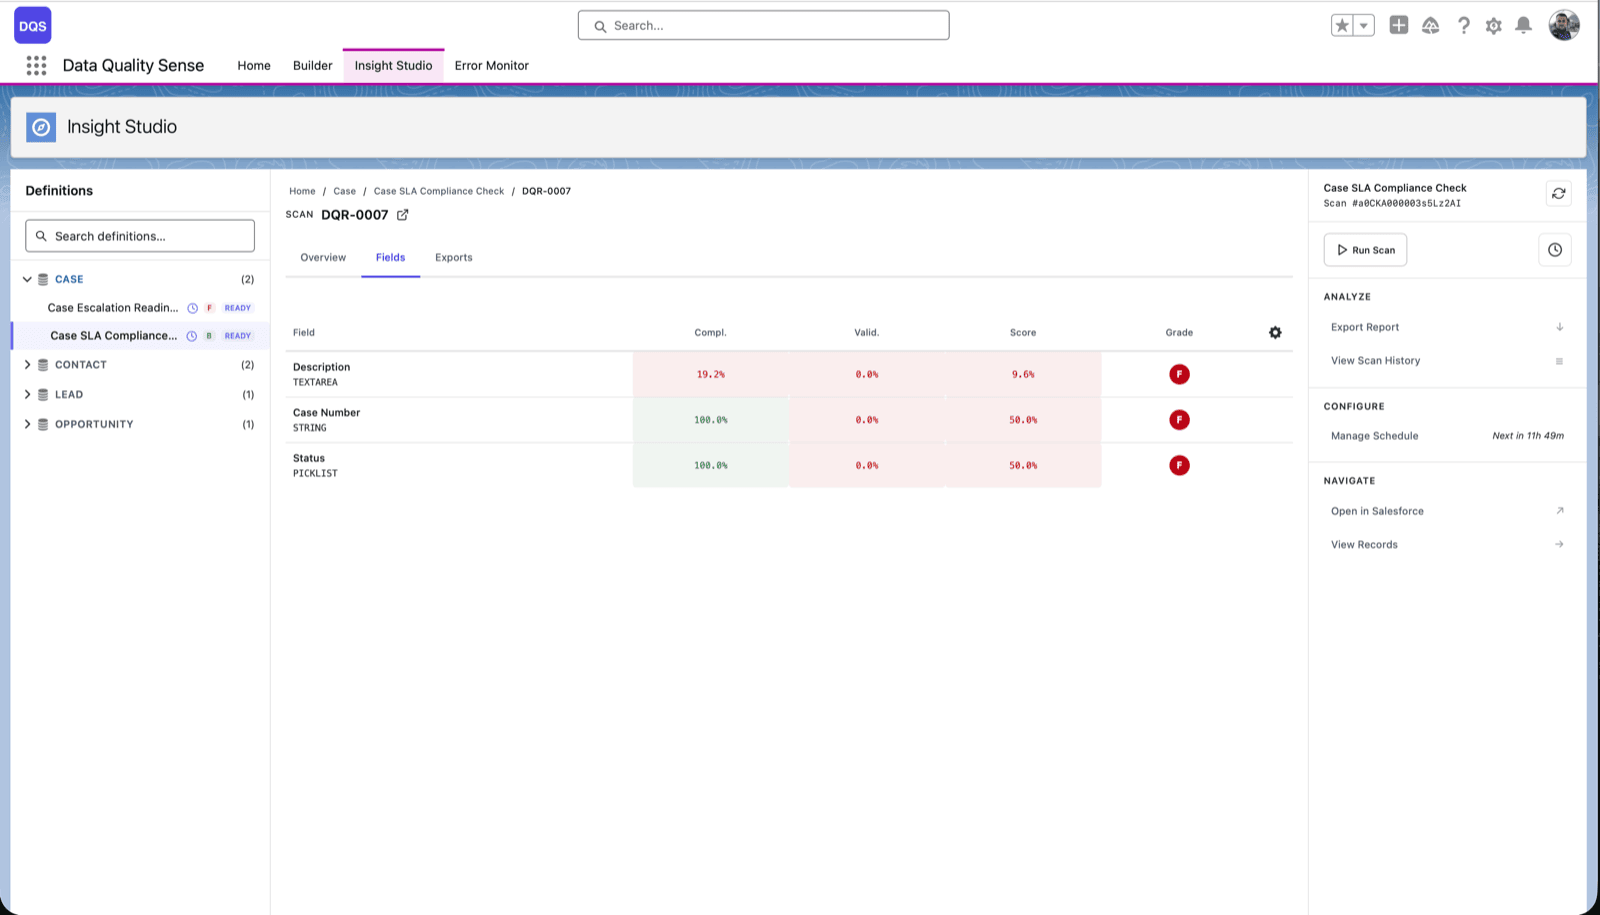
For a walkthrough of reading a scan and turning results into owner assignments, see Understanding your scan results.
Keep reports trustworthy before QBR season
Trust is expensive to rebuild once it is gone, so the goal is to catch the data problems before they reach a leadership deck. A few habits keep reports honest.
Scan the revenue-critical objects on a schedule, not only before a crisis. Opportunities, Accounts, and Contacts are where report-breaking data accumulates fastest, and a scheduled scan catches duplicates and blanks in the days after they arrive rather than the morning of the forecast call.
Watch for the tells. A pipeline total that jumps without new deals points at duplicates. A report that returns fewer records than people expect points at blank fields failing a filter. Open pipeline that never shrinks points at stale opportunities nobody closed.
Run a quality pass before QBR season. In the week before quarterly reviews, scan the objects that feed your board and forecast reports, route the findings, and let owners clean up. Walking into a QBR with numbers people believe is worth far more than a prettier chart.
A dashboard is only as trustworthy as its worst surprise. Diagnose the cause before you touch the report, fix the data where it lives, and the numbers start earning back the trust they lost.
To go deeper on how data quality shapes what your Salesforce reports can and cannot tell you, read Data quality in Salesforce.

Michał Bajdek
Co-Founder, Data Quality Sense
Salesforce Architect and AppExchange ISV founder focused on optimizing enterprise workflows. Certified System and Identity Architect who previously built Salesforce solutions at Accenture, PwC and IBM’s Waeg.