

Key takeaways
- Data quality budgets die because the cost is invisible; fix that by quantifying the pain and showing finance a payback period.
- Build the case as a five-part arc: problem, quantified cost of doing nothing, options with a recommendation, ROI, and one bounded ask.
- Anchor with Gartner's $12.9 million average annual cost and the 1-10-100 rule: $1 to prevent, $10 to correct, $100 to ignore.
- Compute your own annual figure from three inputs: records affected, minutes lost per record, and loaded hourly cost; a believable $180,000 beats an unbelievable $2 million.
- Do not ask finance to fund a cleanup; ask for a two-week pilot scan that produces the evidence for the real proposal.
Data quality budgets die in review for a predictable reason. The cost of bad data is invisible and the benefit of fixing it is diffuse. Finance sees a request to spend real money on a problem nobody can point to, against a return nobody has counted.
You fix that by doing finance’s job for them. Put a number on the pain, propose a cheap first step, and show a payback period in the language they already use. This guide gives you the template to do it.
Why data quality proposals stall
Most requests fail before the numbers are even read. The pitch describes a quality problem in quality language: incomplete fields, duplicate accounts, stale contacts. Finance does not fund cleaner fields. Finance funds recovered hours, protected revenue, and reduced risk.
The second failure is scope. A request to “clean the CRM” reads as open-ended and unbounded. Reviewers cannot size it, so they defer it. A request to scan one object, score it, and report back in two weeks reads as a contained experiment with a clear exit.
The third failure is the missing comparison. Every proposal competes against other proposals. If you do not state what doing nothing costs per year, the reviewer has no baseline to weigh your ask against.
How do you create a business case for data quality improvement?
Build the case as a five-part arc: problem, quantified cost, options, ROI, and the ask. Name the specific pain and who feels it. Attach an annual dollar figure using recovered staff hours and at-risk revenue. Present two or three options with a recommendation, then show the payback period and expected return. Close with a single, bounded request that a reviewer can approve in one meeting.
Everything below expands that arc into a one-page document you can copy.
Quantify the pain before you ask for anything
You need one credible annual number. Two references make it defensible.
Gartner’s widely cited estimate puts the average cost of poor data quality at $12.9 million per year for an organization. Use it to frame the category, not to describe your org. It tells the reviewer this is a known, sized problem, not a pet project.
The 1-10-100 rule (Labovitz and Chang) gives you the logic finance already believes: it costs about $1 to prevent a data error, $10 to correct it later, and $100 if you leave it unaddressed and act on it. This is why detection now beats cleanup later, in terms a CFO respects.
Now build your own figure from the bottom up. You need three inputs, and you can defend each one:
| Input | How to get it | Hypothetical value |
|---|---|---|
| Records affected | A pilot scan (see below) | 18,000 of 60,000 accounts |
| Hours lost per issue | Ask the team, or time a sample | 6 minutes per bad record touched |
| Loaded hourly cost | Finance already has this rate | $45 per hour |
Multiply the hours you can credibly recover by the loaded rate, add any revenue you can tie to bad routing or missed follow-up, and you have an annual cost. Keep the assumptions conservative and visible. A believable $180,000 beats an unbelievable $2 million every time.
All figures in the walkthrough below are illustrative placeholders. Replace them with your own pilot results before you present.
The one-page business case template
Keep it to one page. Reviewers approve what they can read in the meeting. Here is each section with a filled-in hypothetical example beside it.

1. The problem, in one sentence. State the pain and who feels it. No jargon.
Example: Sales reps waste time working duplicate and out-of-date accounts, and marketing spends budget mailing addresses that bounce.
2. The quantified cost of doing nothing. One annual number, with your three inputs shown.
Example: 18,000 flawed account records × 6 minutes recovered each × $45 loaded rate = roughly $81,000 per year in rep time, plus an estimated $40,000 in wasted campaign spend. Annual cost of inaction: about $121,000.
3. The options. Give two or three, with a recommendation. Reviewers trust a choice more than a demand.
Example: (a) Do nothing, absorb the $121,000. (b) One-off manual cleanup by a contractor, one-time cost with no guardrail against recurrence. (c) Measure continuously, fix the highest-cost records first, and prevent backsliding. Recommended: option (c).
4. The ROI and payback period. Cost of the fix, expected return, and how fast it pays back.
Example: First-year cost of the recommended option is about $35,000. Against $121,000 in avoided cost, that is a payback period near 3.5 months and a first-year return of roughly 3.5x.
5. The ask. One bounded, specific request. Make approval a single yes.
Example: Approve a two-week paid pilot to scan the Account object, produce a baseline quality score, and return a costed remediation plan for sign-off.
That last line matters. You are not asking finance to fund a cleanup. You are asking them to fund the measurement that produces the real proposal. The bar to say yes is low, and the pilot is what makes the full number real.
Run a cheap pilot to replace guesses with evidence
The strongest business case rests on your own data, not on a Gartner headline. A pilot gives you that at almost no cost, and it de-risks the ask by proving the problem before you request the big budget.
Scope it small on purpose. Pick one object that finance cares about, usually Account or Contact. Select the fields that drive revenue or routing. Filter to a subset if the org is large. Then measure a baseline and report the number back. This is a real, contained workflow, not a rehearsal.
This is where Data Quality Sense (DQS) fits the strategy. DQS runs a batch scan on any Salesforce object with field selection and scope filters, so scoping a pilot to one object subset is a first-class use, not a workaround. It measures completeness, validity, uniqueness, timeliness, and consistency, then returns a single 0-100 quality score you can put straight into section 2 of the template.
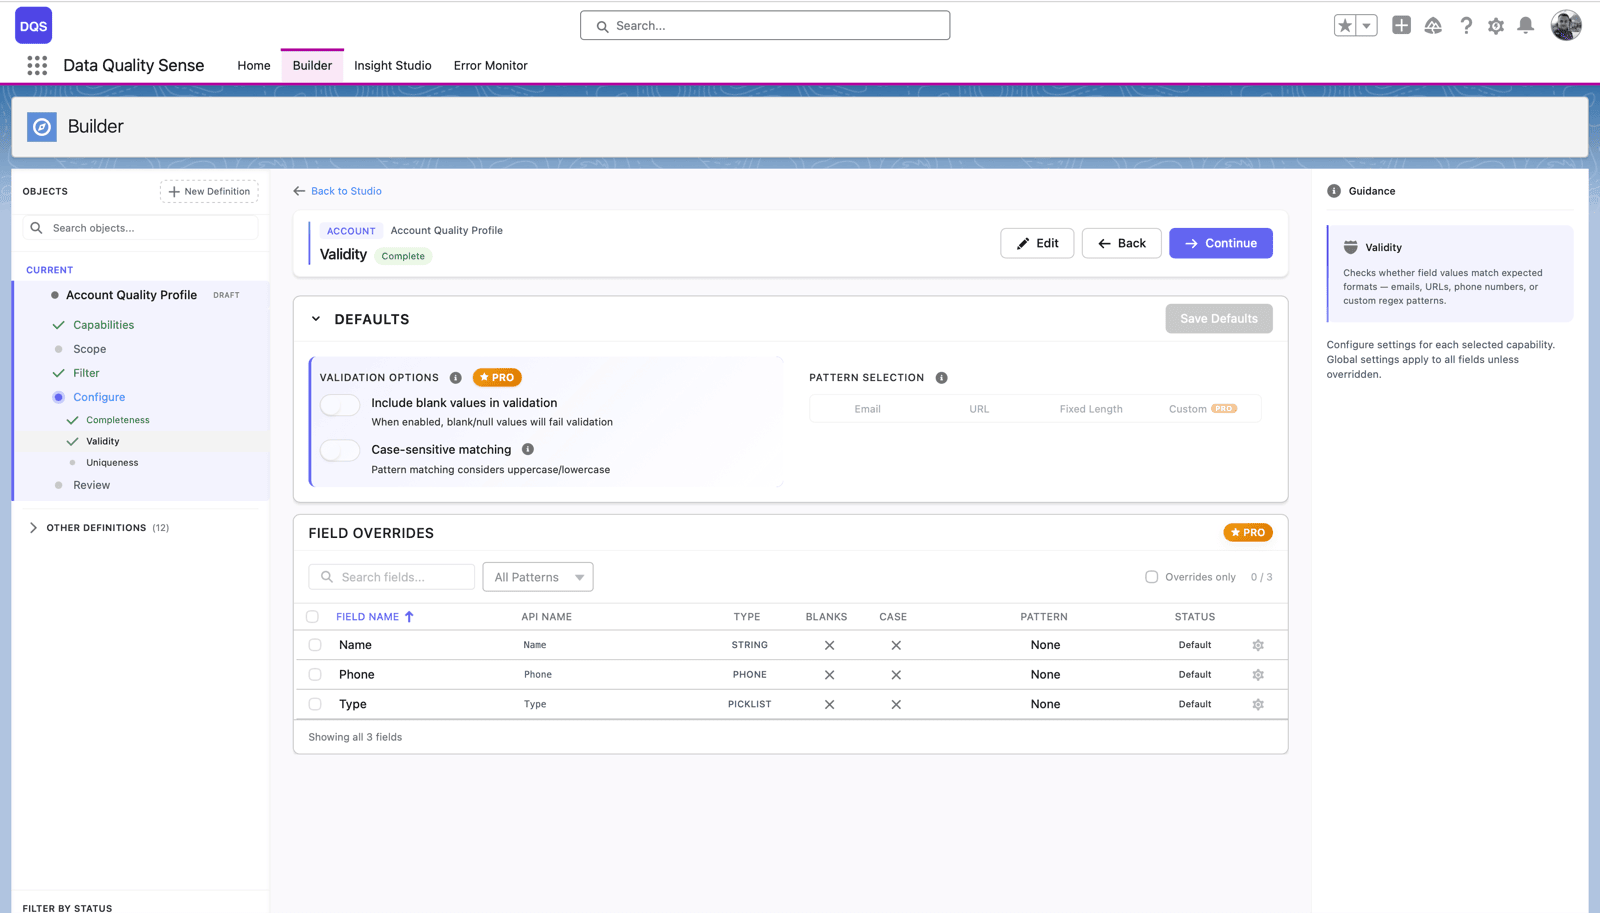
The scan produces the evidence. Insight Studio shows the baseline score and the count of affected records per field, which is exactly the “records affected” input your cost calculation needs.
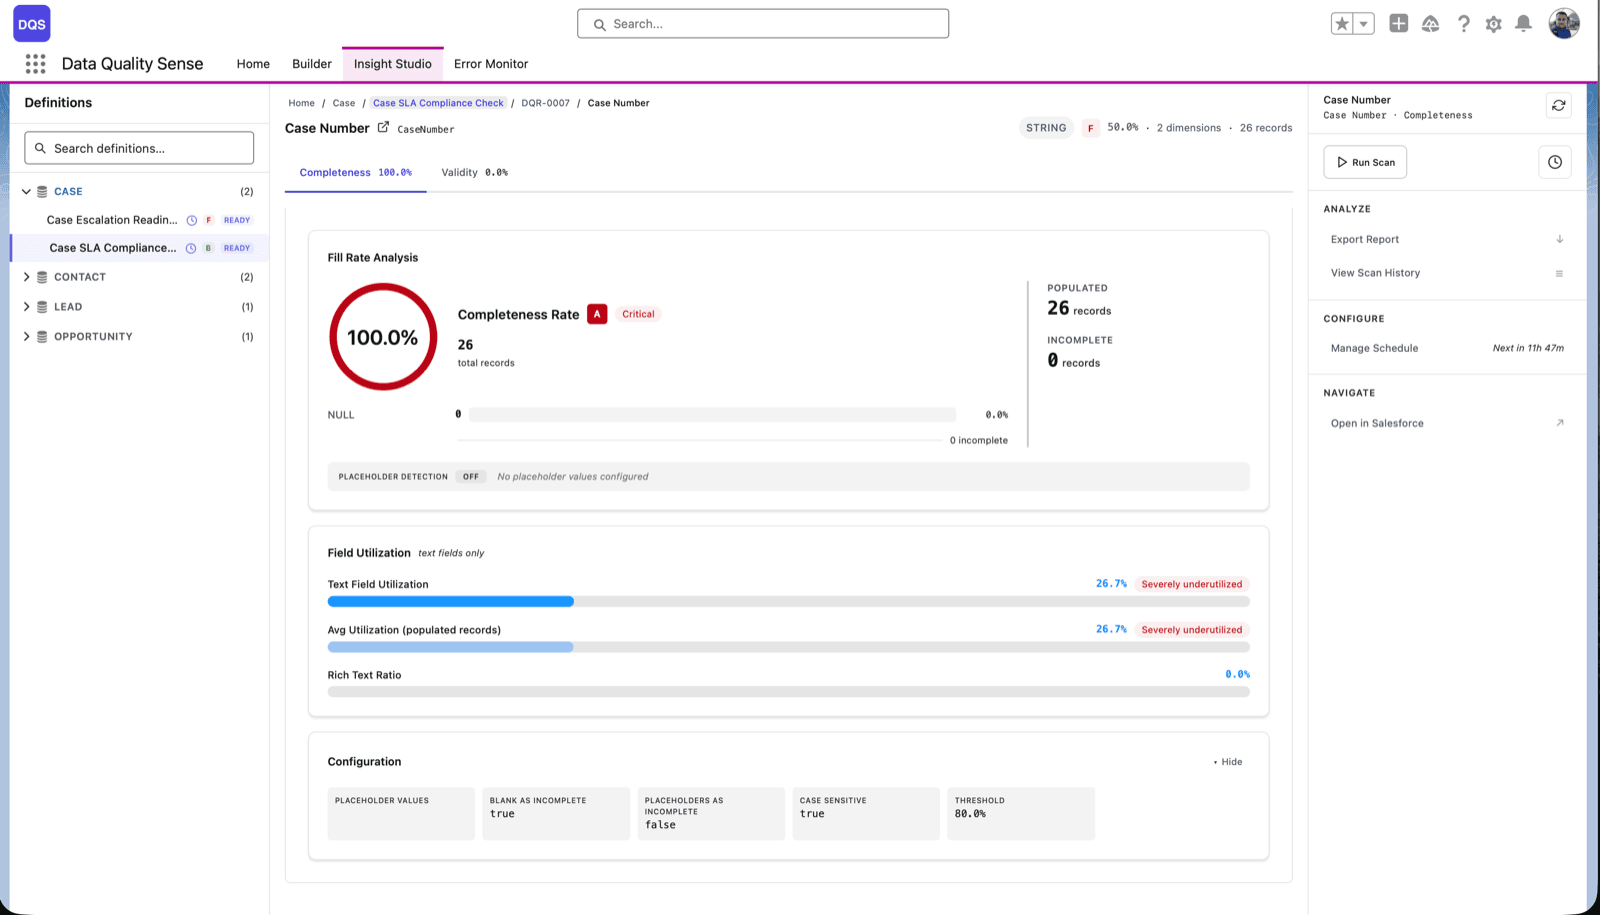
With a real baseline score and a real affected-record count, your annual cost figure stops being a guess. You scanned a subset, you found the number, and you can extrapolate to the full object with a defensible ratio.
To turn those counts into the dollar figure for section 2, use the on-site ROI calculator. It maps records, recovered hours, and loaded cost into an annual figure and a payback period you can paste into the template.
For a deeper set of measures to track after the pilot, see data quality KPIs and metrics.
Handle the two objections before they land
Reviewers reach for the same two objections. Answer them inside the document so nobody has to raise them.
“We will clean it during the next migration.” Migrations move data. They do not judge it. Every duplicate, stale record, and malformed field arrives intact on the other side, now mapped into new structures that can multiply the mess. Waiting for a migration also delays the recovered hours by however many quarters that project slips. The 1-10-100 logic applies directly: deferring correction raises the cost of the same error.
“The reps will keep it clean themselves.” Reps update data when it is fast and when they trust it. Neither holds in an org that is already degraded. Manual hygiene has no baseline, no owner, and no report, so nobody can tell whether it is working. A measured score gives you the one thing rep goodwill cannot: proof.
Bring it back to the number
Finance approves data quality when it stops being a quality conversation and becomes a cost conversation. Quantify the annual pain with a credible bottom-up figure. Anchor it with the Gartner and 1-10-100 references. Then shrink the ask to a two-week pilot that produces the evidence for everything that follows.
A DQS scan is that pilot. Scope it to one object, read the baseline score, count the affected records, and run those numbers through the ROI calculator. You walk into the review with a payback period, not a plea, and that is the version finance signs off.

Artur Kolasa
Co-Founder, Data Quality Sense
Salesforce Certified Technical Architect helping global enterprises turn business goals into scalable Salesforce strategies. A decade of delivery and architecture leadership across Accenture, PwC, IBM’s Waeg and Publicis Sapient.